> ## Documentation Index
> Fetch the complete documentation index at: https://docs.beam.ai/llms.txt
> Use this file to discover all available pages before exploring further.
# Overview Analytics
> Monitor agent performance, task completion rates, evaluation scores, and user feedback through the centralized Analytics dashboard
The Analytics dashboard provides real-time visibility into agent performance across key metrics—completion rates, evaluation scores, runtime, and user feedback—enabling data-driven optimization decisions.
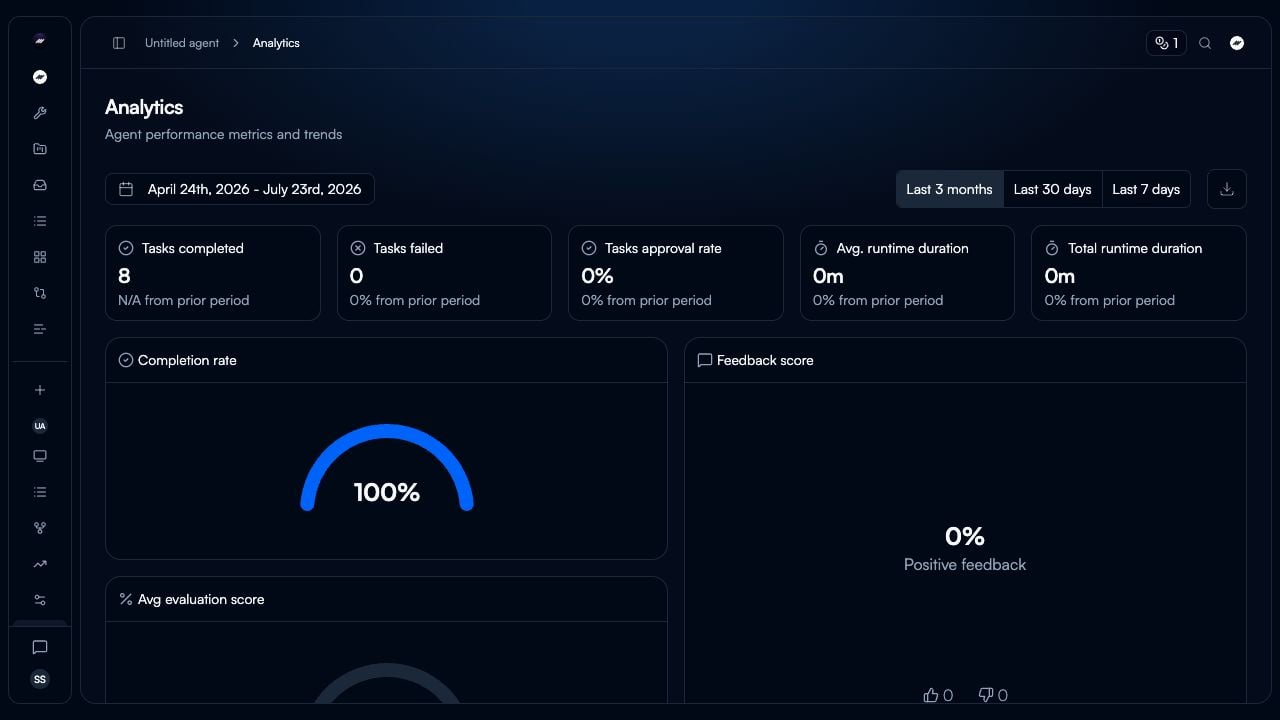
Understanding the Analytics Dashboard
Access comprehensive performance insights for any agent by navigating to **Analytics** in the agent sidebar.
**Date range** - Use the date picker or choose **Last 7 days**, **Last 30 days**, or **Last 3 months** to filter metrics and trends
**Task summary cards** - Five indicators displayed at the top of the dashboard:
* Tasks completed
* Tasks failed
* Tasks approval rate (for HITL workflows)
* Avg. runtime duration
* Total runtime duration
**Performance summaries** - Separate panels below the task summary cards show:
* Completion rate (percentage of tasks finishing successfully)
* Average evaluation score (mean accuracy across all evaluated nodes)
* Feedback score (positive vs negative user ratings)
**Trend charts** - The lower dashboard shows:
* **Evaluation scores history**, showing average evaluation scores across the selected period
* **Tasks**, showing completed and failed task counts across the selected period
* **Credit consumption**, showing credit usage across the selected period
When no tasks fall within the selected date range, the summary values display `0` and the history charts show **No data available for this period**.
Key Metrics Explained
Tasks Completed
**What it measures:** Total number of tasks that executed successfully and reached completion without errors.
**Dashboard display:** Numeric count with percentage change from prior period (e.g., "+118.60% from prior period")
**What to monitor:**
* Steady growth indicates healthy agent adoption
* Sudden drops may signal workflow issues or reduced triggering
* Compare against tasks failed to calculate success rate
**Related pages:**
* [Task Executions](/03-running-operations/task-management/task-executions/task-executions) - View individual task details and execution logs
Tasks Failed
**What it measures:** Total number of tasks that encountered errors and did not complete successfully.
**Dashboard display:** Numeric count with percentage change from prior period (e.g., "-100.00% from prior period" when zero failures)
**What to monitor:**
* Target: 0 failures or \<5% failure rate
* Investigate any non-zero values immediately
* Use [Debug Tools](/03-running-operations/debugging-testing/debug-tools/debug-tools) to diagnose failures
**Common failure causes:**
* Integration authentication errors
* Missing required input data
* Timeout errors on complex workflows
* API rate limiting
**Related pages:**
* [Debug Tools](/03-running-operations/debugging-testing/debug-tools/debug-tools) - Diagnose and resolve execution errors
* [Rerunning Tasks](/03-running-operations/debugging-testing/rerunning-tasks/rerunning-tasks) - Retry failed tasks after fixes
Tasks Approval Rate
**What it measures:** Percentage of tasks requiring human approval that were approved vs rejected in HITL workflows.
**Dashboard display:** Percentage with change from prior period (e.g., "0% from prior period")
**What to monitor:**
* High rejection rates (>20%) indicate agent output quality issues
* Use rejected task feedback to improve prompts
* Consider adding [Evaluation Criteria](/04-observability-analytics/evaluation-framework/evaluation-framework) to catch issues before human review
**When this appears:**
* Only visible for agents with [Automation Modes](/03-running-operations/task-management/automation-modes/automation-modes) configured for human-in-the-loop (HITL)
* Shows 0% if no approval checkpoints configured
**Related pages:**
* [Automation Modes](/03-running-operations/task-management/automation-modes/automation-modes) - Configure HITL approval checkpoints
Average Runtime
**What it measures:** Mean execution time per task from trigger to completion.
**Dashboard display:** Duration in minutes and seconds (e.g., "4m") with percentage change from prior period
**What to monitor:**
* Baseline your typical runtime for the agent's workflow complexity
* Sudden increases may indicate:
* Integration slowdowns
* Increased prompt complexity
* Model performance degradation
* Network latency issues
**Optimization strategies:**
* Review slow nodes using execution logs
* Simplify prompts where possible
* Use faster LLM models for non-critical steps
* Implement parallel execution for independent tasks
Total Runtime
**What it measures:** Cumulative execution time across all completed tasks in the selected date range.
**Dashboard display:** Duration in hours and minutes (e.g., "21h 17m") with percentage change
**What this indicates:**
* Overall agent workload and resource consumption
* High values with high task counts = good adoption
* High values with low task counts = workflow inefficiency
Completion Rate
**What it measures:** Percentage of tasks that finished successfully out of total tasks attempted.
**Dashboard display:** Large circular gauge showing percentage (e.g., "98.95%")
**Target benchmarks:**
* **95-100%:** Excellent - Agent highly reliable
* **90-94%:** Good - Minor optimization opportunities
* **85-89%:** Acceptable - Investigate frequent failure patterns
* **\<85%:** Needs attention - Significant reliability issues
**Calculation:** `(Tasks Completed / (Tasks Completed + Tasks Failed)) × 100`
**How to improve:**
* Identify and fix common failure patterns using [Debug Tools](/03-running-operations/debugging-testing/debug-tools/debug-tools)
* Add error handling and retry logic to workflow nodes
* Validate integrations are properly authenticated
* Use [Test Datasets](/03-running-operations/debugging-testing/test-datasets/test-datasets) to catch issues before production
**Related pages:**
* [Debug Tools](/03-running-operations/debugging-testing/debug-tools/debug-tools) - Systematic error diagnosis
* [Rerunning Tasks](/03-running-operations/debugging-testing/rerunning-tasks/rerunning-tasks) - Retry and validate fixes
Average Evaluation Score
**What it measures:** Mean accuracy percentage across all nodes with evaluation criteria configured.
**Dashboard display:** Large circular gauge showing percentage (e.g., "98.41%")
**Target benchmarks:**
* **95-100%:** Excellent - Evaluation criteria well-calibrated
* **90-94%:** Good - Minor prompt optimization opportunities
* **85-89%:** Acceptable - Review criteria strictness and prompt quality
* **\<85%:** Needs improvement - Systematic quality issues
**What this indicates:**
* How well agent outputs match defined quality standards
* Effectiveness of evaluation criteria configuration
* Need for prompt optimization
**How to improve:**
* Use [Optimize Outputs](/04-observability-analytics/optimize-outputs/optimize-outputs) to automatically improve underperforming nodes
* Review and refine evaluation criteria for balance between strictness and practicality
* Enable auto-run on low-scoring nodes for self-healing
* Analyze failed evaluations to identify patterns
**When this appears:**
* Only shows data for agents with [Evaluation Framework](/04-observability-analytics/evaluation-framework/evaluation-framework) criteria configured
* Empty if no evaluation criteria defined on any workflow nodes
**Related pages:**
* [Evaluation Framework](/04-observability-analytics/evaluation-framework/evaluation-framework) - Configure validation criteria and auto-run
* [Optimize Outputs](/04-observability-analytics/optimize-outputs/optimize-outputs) - AI-powered prompt optimization
Feedback Score
**What it measures:** User satisfaction with agent outputs based on thumbs up/down ratings.
**Dashboard display:** Large circular gauge showing percentage positive (e.g., "100% Positive feedback") with breakdown of positive (👍) vs negative (👎) counts
**Target benchmarks:**
* **90-100%:** Excellent - Users highly satisfied with outputs
* **80-89%:** Good - Minor quality improvements needed
* **70-79%:** Acceptable - Address common user complaints
* **\<70%:** Needs attention - Systematic output quality issues
**How users provide feedback:**
* Thumbs up/down buttons on task execution results
* Feedback captured per task or per workflow step
* Comments can accompany ratings for qualitative insights
**How to improve:**
* Review negative feedback comments to identify common issues
* Use feedback to refine prompts and evaluation criteria
* Implement feedback-driven optimization via [Optimize Outputs](/04-observability-analytics/optimize-outputs/optimize-outputs)
* Consider if evaluation criteria align with user expectations
**Related pages:**
* [Optimize Outputs](/04-observability-analytics/optimize-outputs/optimize-outputs) - Learn from user feedback to improve prompts
Using Analytics for Optimization
**Low Completion Rate + High Failures:**
* **Issue:** Workflow reliability problems
* **Action:** Use [Debug Tools](/03-running-operations/debugging-testing/debug-tools/debug-tools) to diagnose common failure patterns
* **Validation:** Create [Test Datasets](/03-running-operations/debugging-testing/test-datasets/test-datasets) covering failure scenarios
**Low Evaluation Score + High Completion Rate:**
* **Issue:** Agent completing tasks but with poor quality
* **Action:** Use [Optimize Outputs](/04-observability-analytics/optimize-outputs/optimize-outputs) to improve underperforming nodes
* **Validation:** Review [Evaluation Framework](/04-observability-analytics/evaluation-framework/evaluation-framework) criteria for balance
**Low Feedback Score + High Evaluation Score:**
* **Issue:** Evaluation criteria don't match user expectations
* **Action:** Review negative feedback comments and adjust evaluation criteria
* **Validation:** Incorporate user feedback patterns into evaluation rules
**High Average Runtime + Low Task Count:**
* **Issue:** Workflow inefficiency limiting adoption
* **Action:** Identify slow nodes in execution logs and optimize prompts or use faster models
* **Validation:** Monitor runtime trends after optimization
Tracking Improvement Trends
**After Prompt Optimization:**
1. Note baseline evaluation score and completion rate
2. Apply optimization via [Optimize Outputs](/04-observability-analytics/optimize-outputs/optimize-outputs)
3. Monitor analytics for 7-14 days
4. Expect 10-40% improvement in evaluation scores
5. Document successful optimization patterns
**After Adding Evaluation Criteria:**
1. Baseline period shows no evaluation score
2. After criteria deployment, evaluation score appears
3. Initial scores typically 70-85% as criteria are calibrated
4. Use auto-run to self-heal low scores
5. Scores stabilize at 90-95% after 2-4 weeks
**After HITL Implementation:**
1. Approval rate metric appears
2. Initial rejection rates often 15-30% as agents learn
3. Use rejection feedback to refine prompts
4. Target 5-10% rejection rate for mature agents
5. High approval rates indicate agents ready for full automation
Best Practices
**Daily (for new agents):**
* Check completion rate and failure count
* Review any failed tasks immediately
* Monitor evaluation scores for instability
**Weekly (for stable agents):**
* Review all key metrics for trends
* Compare current week vs prior week performance
* Investigate any metric degradation >10%
* Celebrate improvements with stakeholders
**Monthly (for mature agents):**
* Analyze trends across 30-day and 3-month views
* Identify seasonal patterns or usage changes
* Plan optimization initiatives based on data
* Review and update evaluation criteria if needed
**New Agent Baseline (First 30 Days):**
* Completion rate: 85-90% acceptable as agent stabilizes
* Evaluation score: 75-85% during calibration
* Feedback score: 80-90% as users learn agent capabilities
* Average runtime: Establish typical duration for workflow complexity
**Mature Agent Targets (After 30 Days):**
* Completion rate: 95%+
* Evaluation score: 90%+
* Feedback score: 90%+
* Average runtime: Within 10% of baseline
**Document Baselines:**
* Record initial metrics when agent goes live
* Note any major workflow changes affecting comparability
* Use baselines to calculate ROI and improvement percentages
**Sudden Drops (>20% decrease overnight):**
* **Likely causes:** Integration outage, authentication failure, upstream system change
* **Action:** Check recent workflow changes, verify integrations, review execution logs
* **Urgency:** High - investigate within 1 hour
**Gradual Decline (10-20% decrease over 1-2 weeks):**
* **Likely causes:** Data drift, prompt degradation, evaluation criteria misalignment
* **Action:** Analyze recent task executions, run test datasets, consider re-optimization
* **Urgency:** Medium - investigate within 1 day
**Unexpected Spike (task count increases >50%):**
* **Likely causes:** New trigger source, increased adoption, duplicate triggering
* **Action:** Verify expected behavior, check for duplicate task creation, validate trigger configuration
* **Urgency:** Medium - investigate within 1 day
**Metric Stagnation (no change for 2+ weeks):**
* **Likely causes:** Stable agent performance OR lack of usage
* **Action:** Verify task triggering is occurring, check if usage patterns changed
* **Urgency:** Low - review during weekly check-in
**Benchmarking Similar Agents:**
* Compare completion rates for agents handling similar complexity
* Identify highest-performing agents and analyze their prompts/configuration
* Use top performers as templates for new agents
**Workflow Complexity Tiers:**
* **Simple (1-3 nodes):** Target 98%+ completion, 95%+ evaluation
* **Medium (4-8 nodes):** Target 95%+ completion, 90%+ evaluation
* **Complex (9+ nodes):** Target 92%+ completion, 88%+ evaluation
**Industry Standards:**
* Invoice processing: 95%+ completion, 95%+ evaluation
* Email triage: 97%+ completion, 90%+ evaluation
* Data extraction: 90%+ completion, 93%+ evaluation
* Customer inquiry: 93%+ completion, 88%+ evaluation
Next Steps
Set up evaluation criteria to measure and track output quality
Use AI to improve agent accuracy when evaluation scores are low
Drill into individual task details and execution logs
Diagnose and resolve failures affecting completion rate