Understanding Task Executions
Every task execution represents a single workflow run from trigger to completion. Beam captures the complete execution trace including: Execution Metadata - Task ID, trigger source, start/end timestamps, overall status Workflow Steps - Every node executed with inputs, outputs, and tool usage Branch Decisions - Which paths were selected and why based on conditions Evaluation Metrics - Accuracy scores and validation results per step Performance Data - Execution duration, token usage, API calls madeViewing Task Executions
Tasks Overview
The Tasks page displays all executions for your agent in chronological order.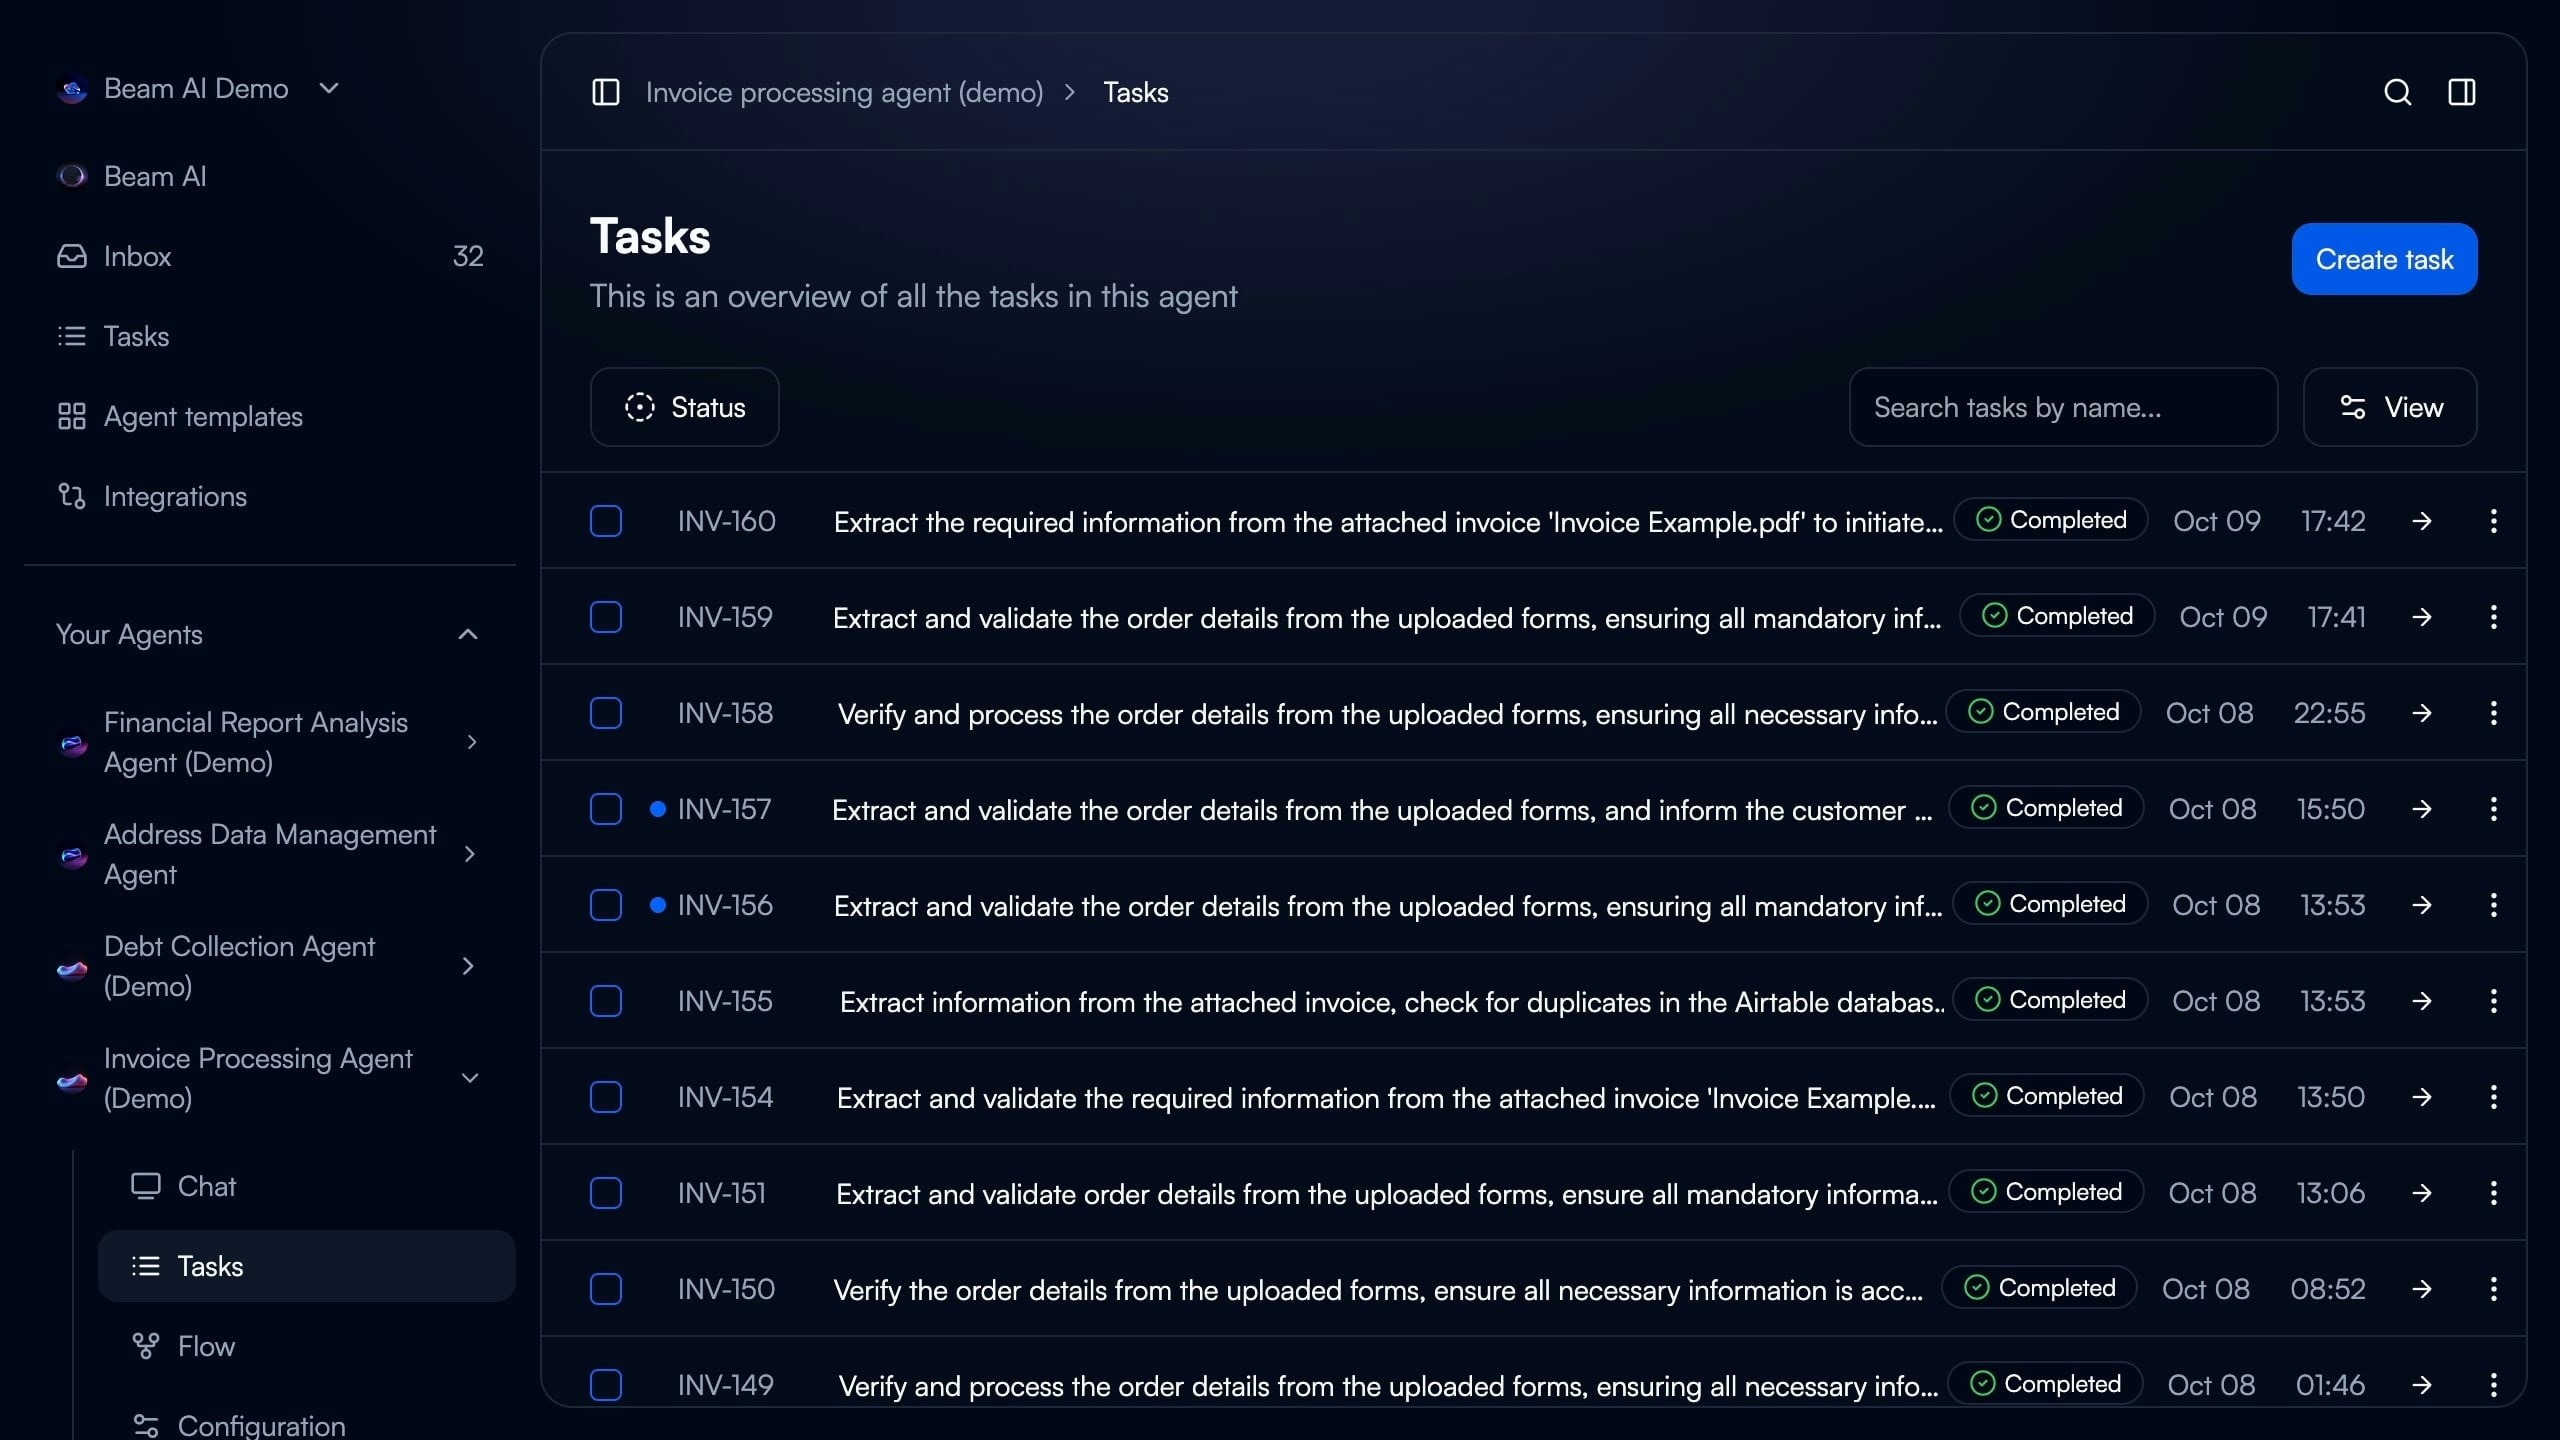
- Task ID: Unique identifier and custom task number
- Description: Auto-generated summary from trigger input or manual entry
- Status Indicator: Completed (green), In Progress (blue), Failed (red), Pending (gray)
- Timestamp: Execution start time and date
- Search & Filter: Find tasks by name, status, or date range
- Create Task: Manually trigger new execution
Completed
Workflow finished successfully through all nodes to exit point
In Progress
Currently executing - real-time updates as nodes complete
Failed
Stopped due to error, timeout, or validation failure
Pending
Queued for execution or awaiting human approval (HITL mode)
Task Execution Details
Click any task to view the complete execution breakdown in the right panel.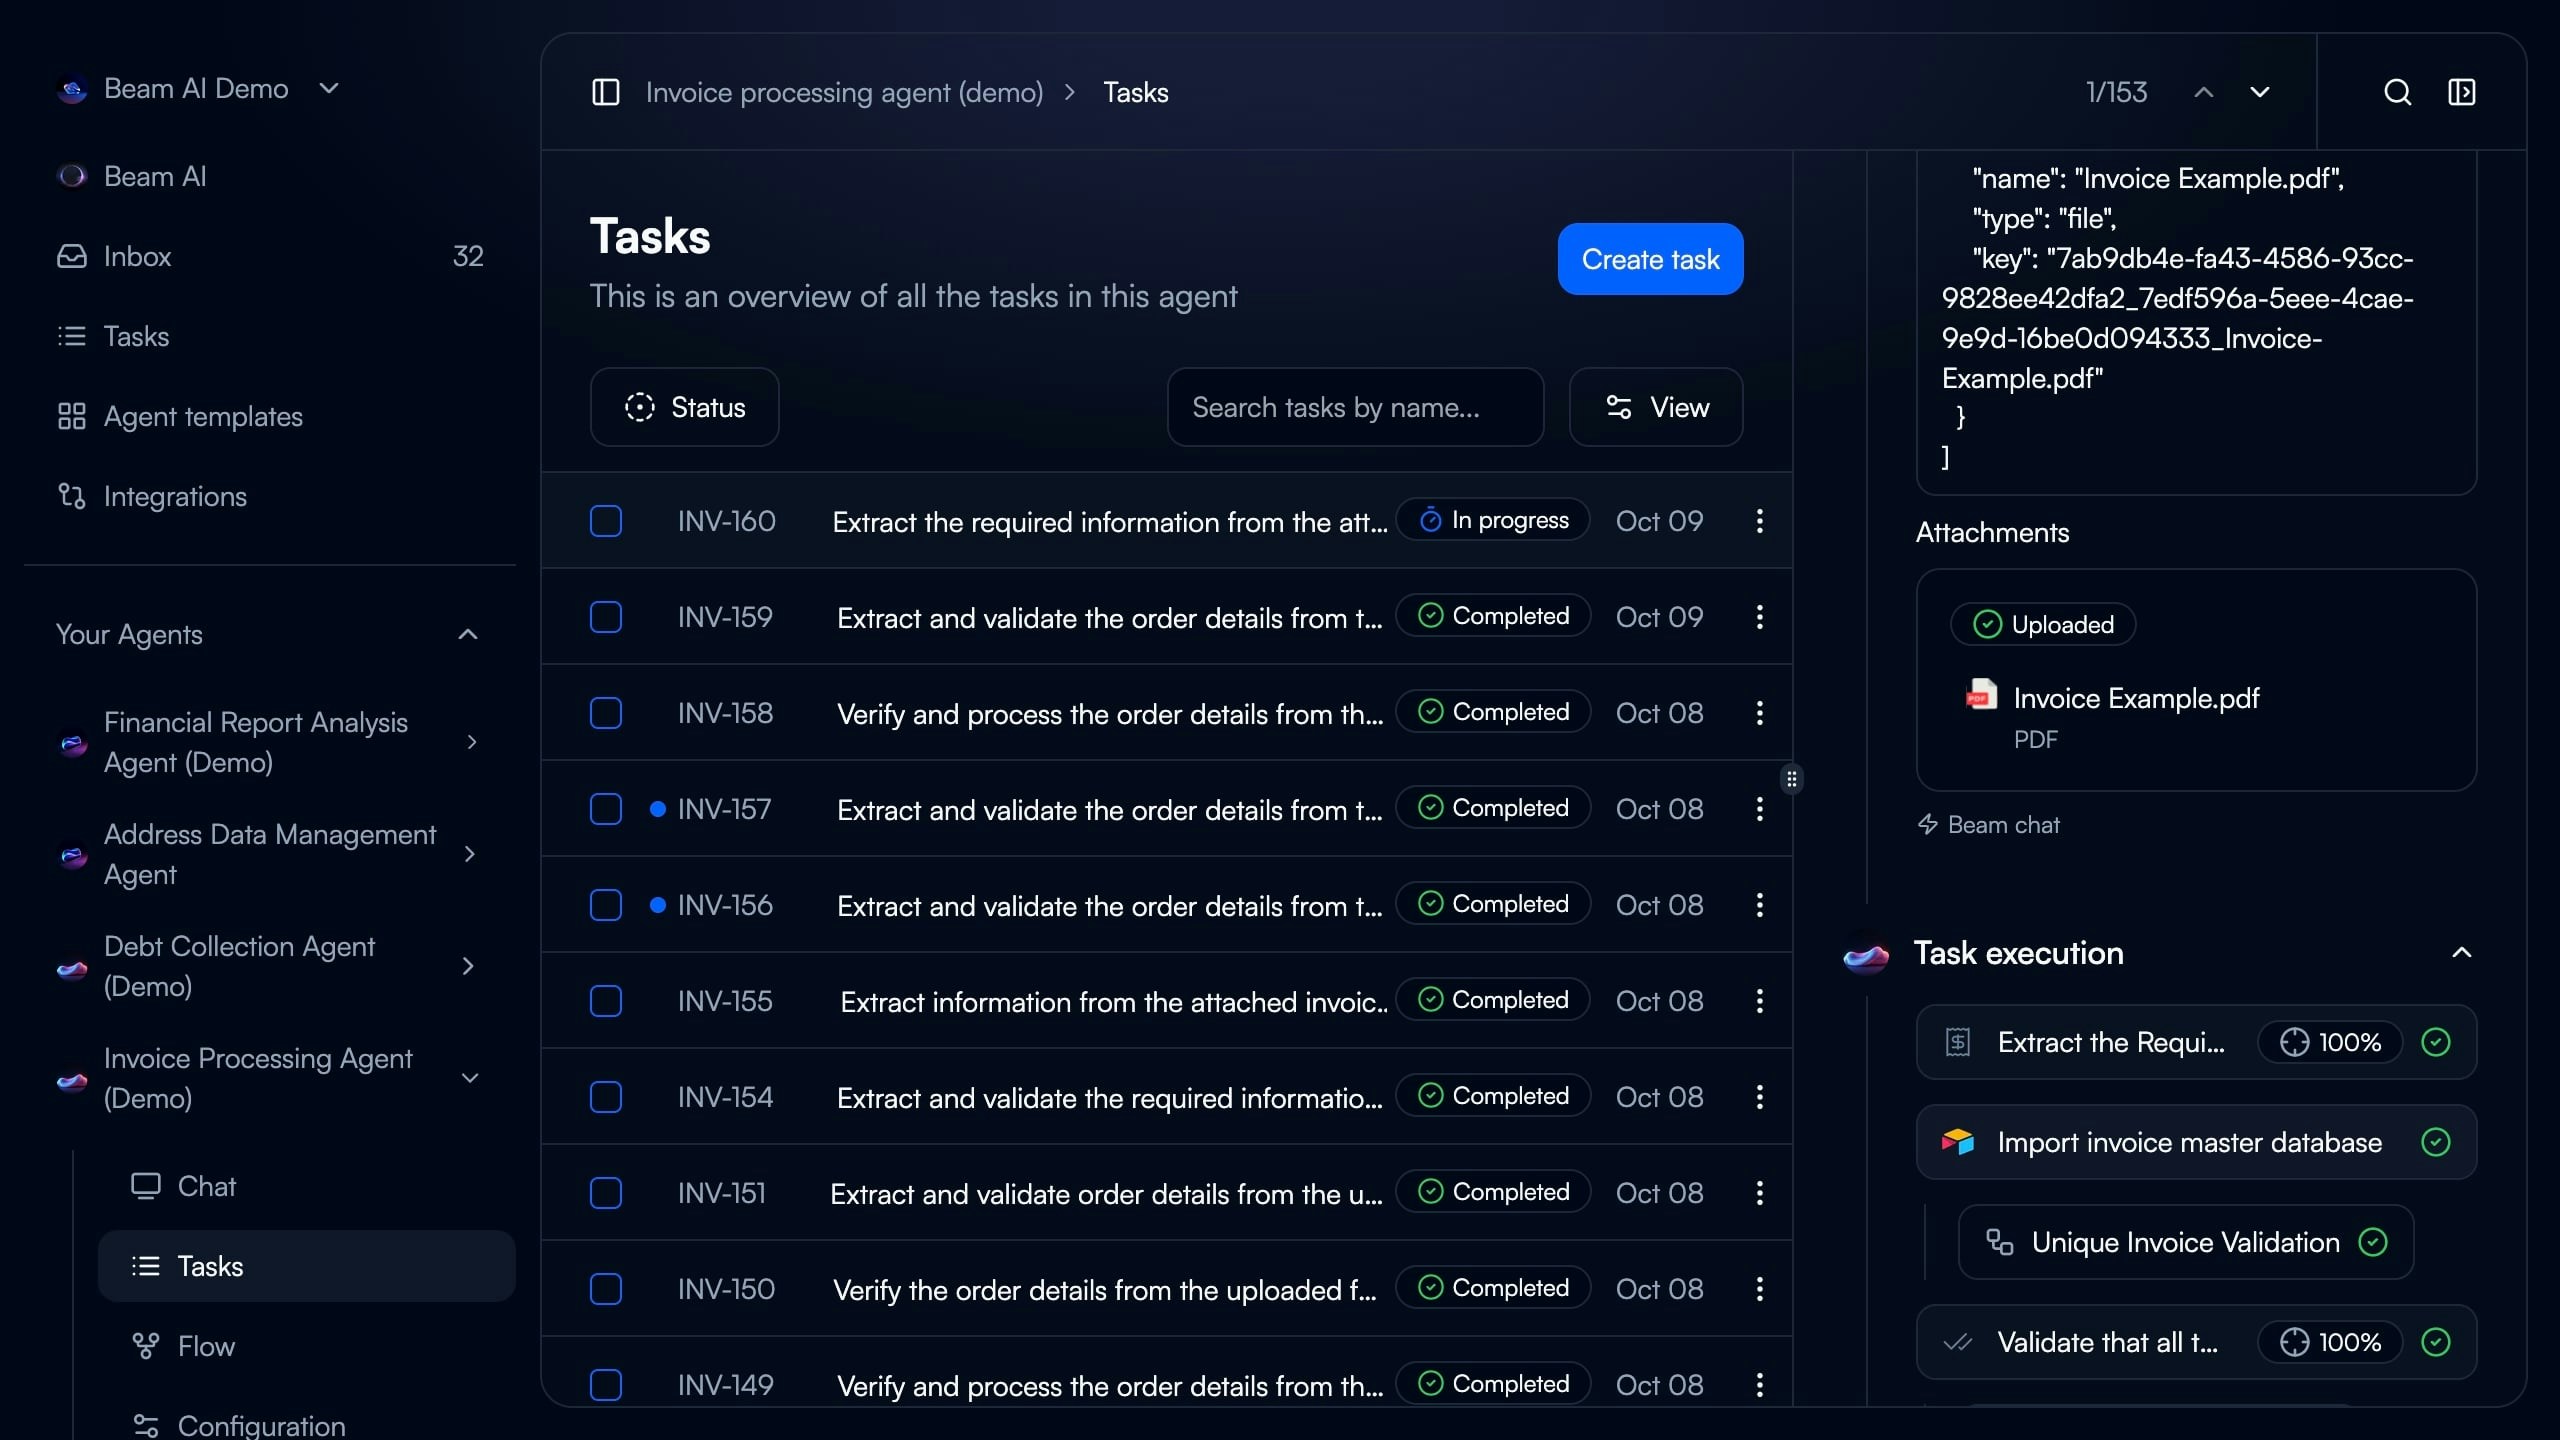
Analyzing Executions
Workflow Step Breakdown
Each step in the timeline shows the exact sequence of agent actions.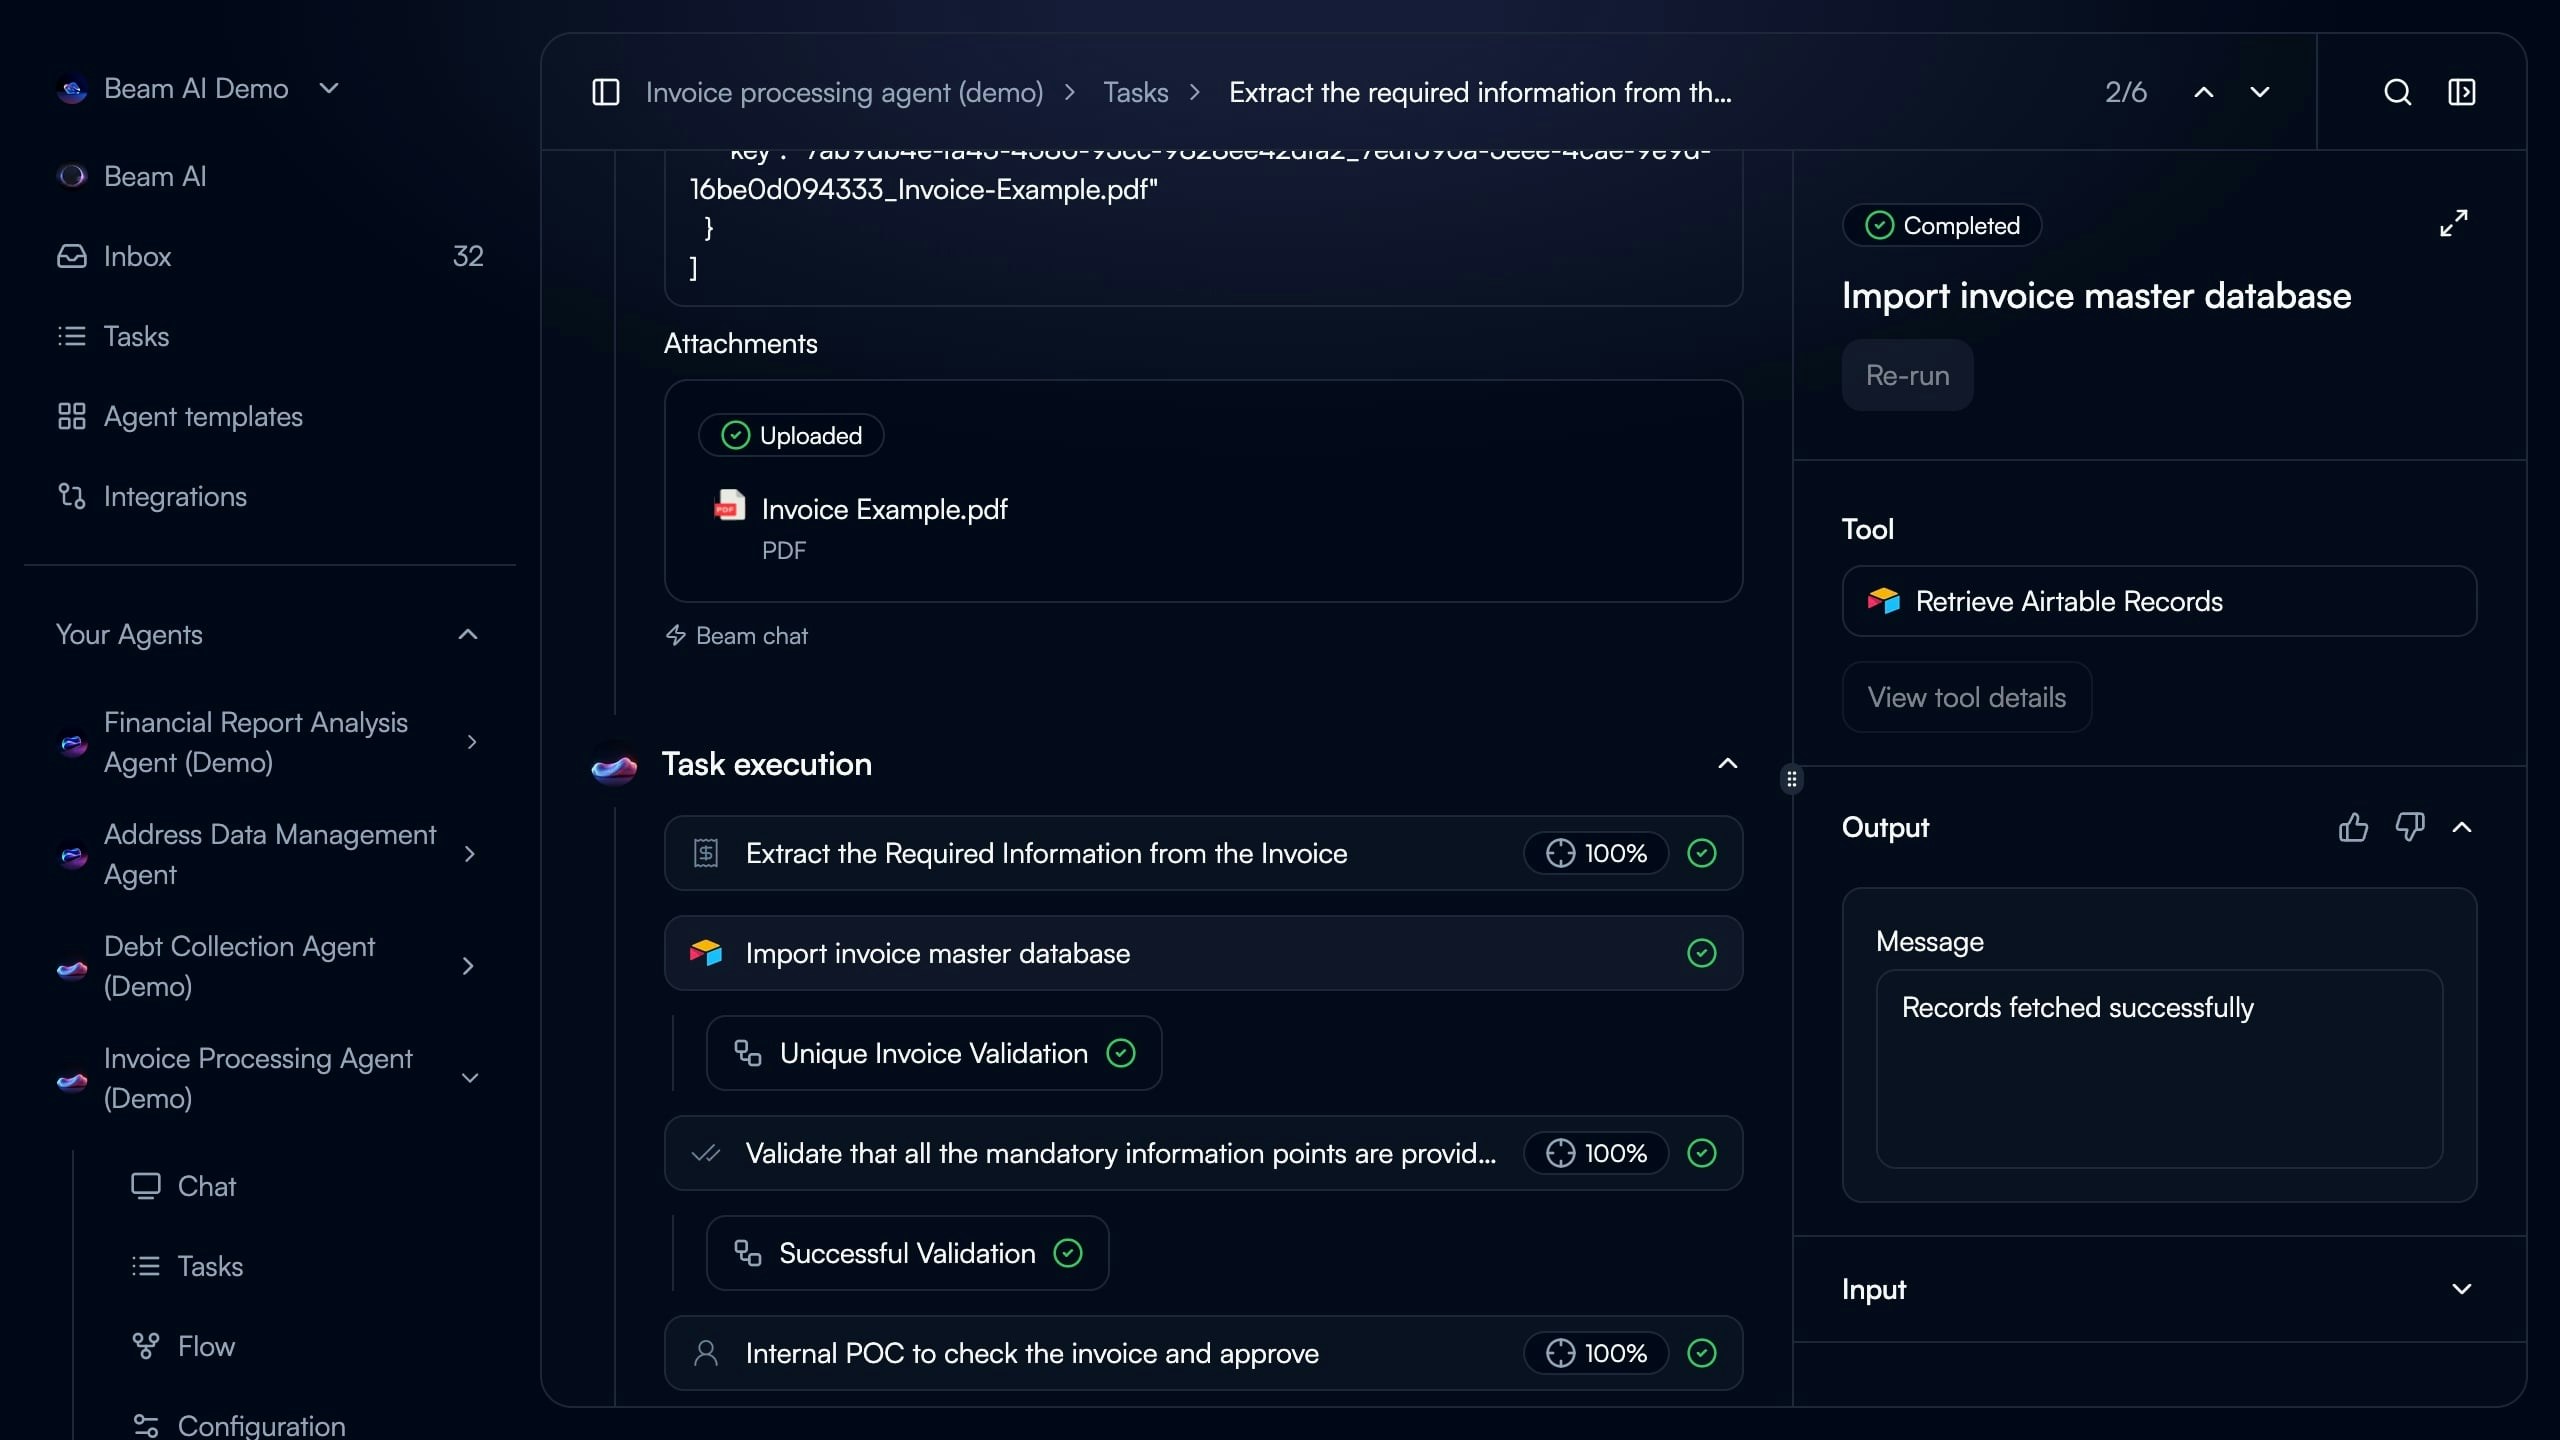
- Step Name: Node objective (e.g., “Extract the Required Information from the Invoice”)
- Tool Used: Integration or Custom GPT tool icon
- Accuracy Score: Evaluation percentage (100%, 95%, etc.)
- Status Icon: Green checkmark (passed), red X (failed), yellow warning (needs review)
- ✅ Green Checkmark: Step completed successfully, passed all evaluations
- ❌ Red X: Step failed validation or encountered error
- ⚠️ Yellow Warning: Step completed but flagged for review
- 🔄 Blue Spinner: Currently executing in real-time
Step Input & Output
Step Input & Output
Step Input - Shows the exact data the node received:
- Variables from trigger (
task_query) - Outputs from previous nodes
- Static configuration values
- Memory file references
- Extracted data from documents
- API responses from integrations
- Generated text or classifications
- Structured JSON objects
Tool & Reasoning
Tool & Reasoning
Explains how the agent approached the task:
- Which tool was selected and why
- Decision logic and confidence scores
- Alternative approaches considered
- Evaluation criteria applied
Evaluation Metrics
Evaluation Metrics
Shows accuracy and quality scores:
- Overall step accuracy percentage
- Individual criterion pass/fail status
- Auto-generated evaluation rules
- Feedback and improvement suggestions
Branch Logic & Path Selection
Agents make decisions on which workflow path to follow based on conditions.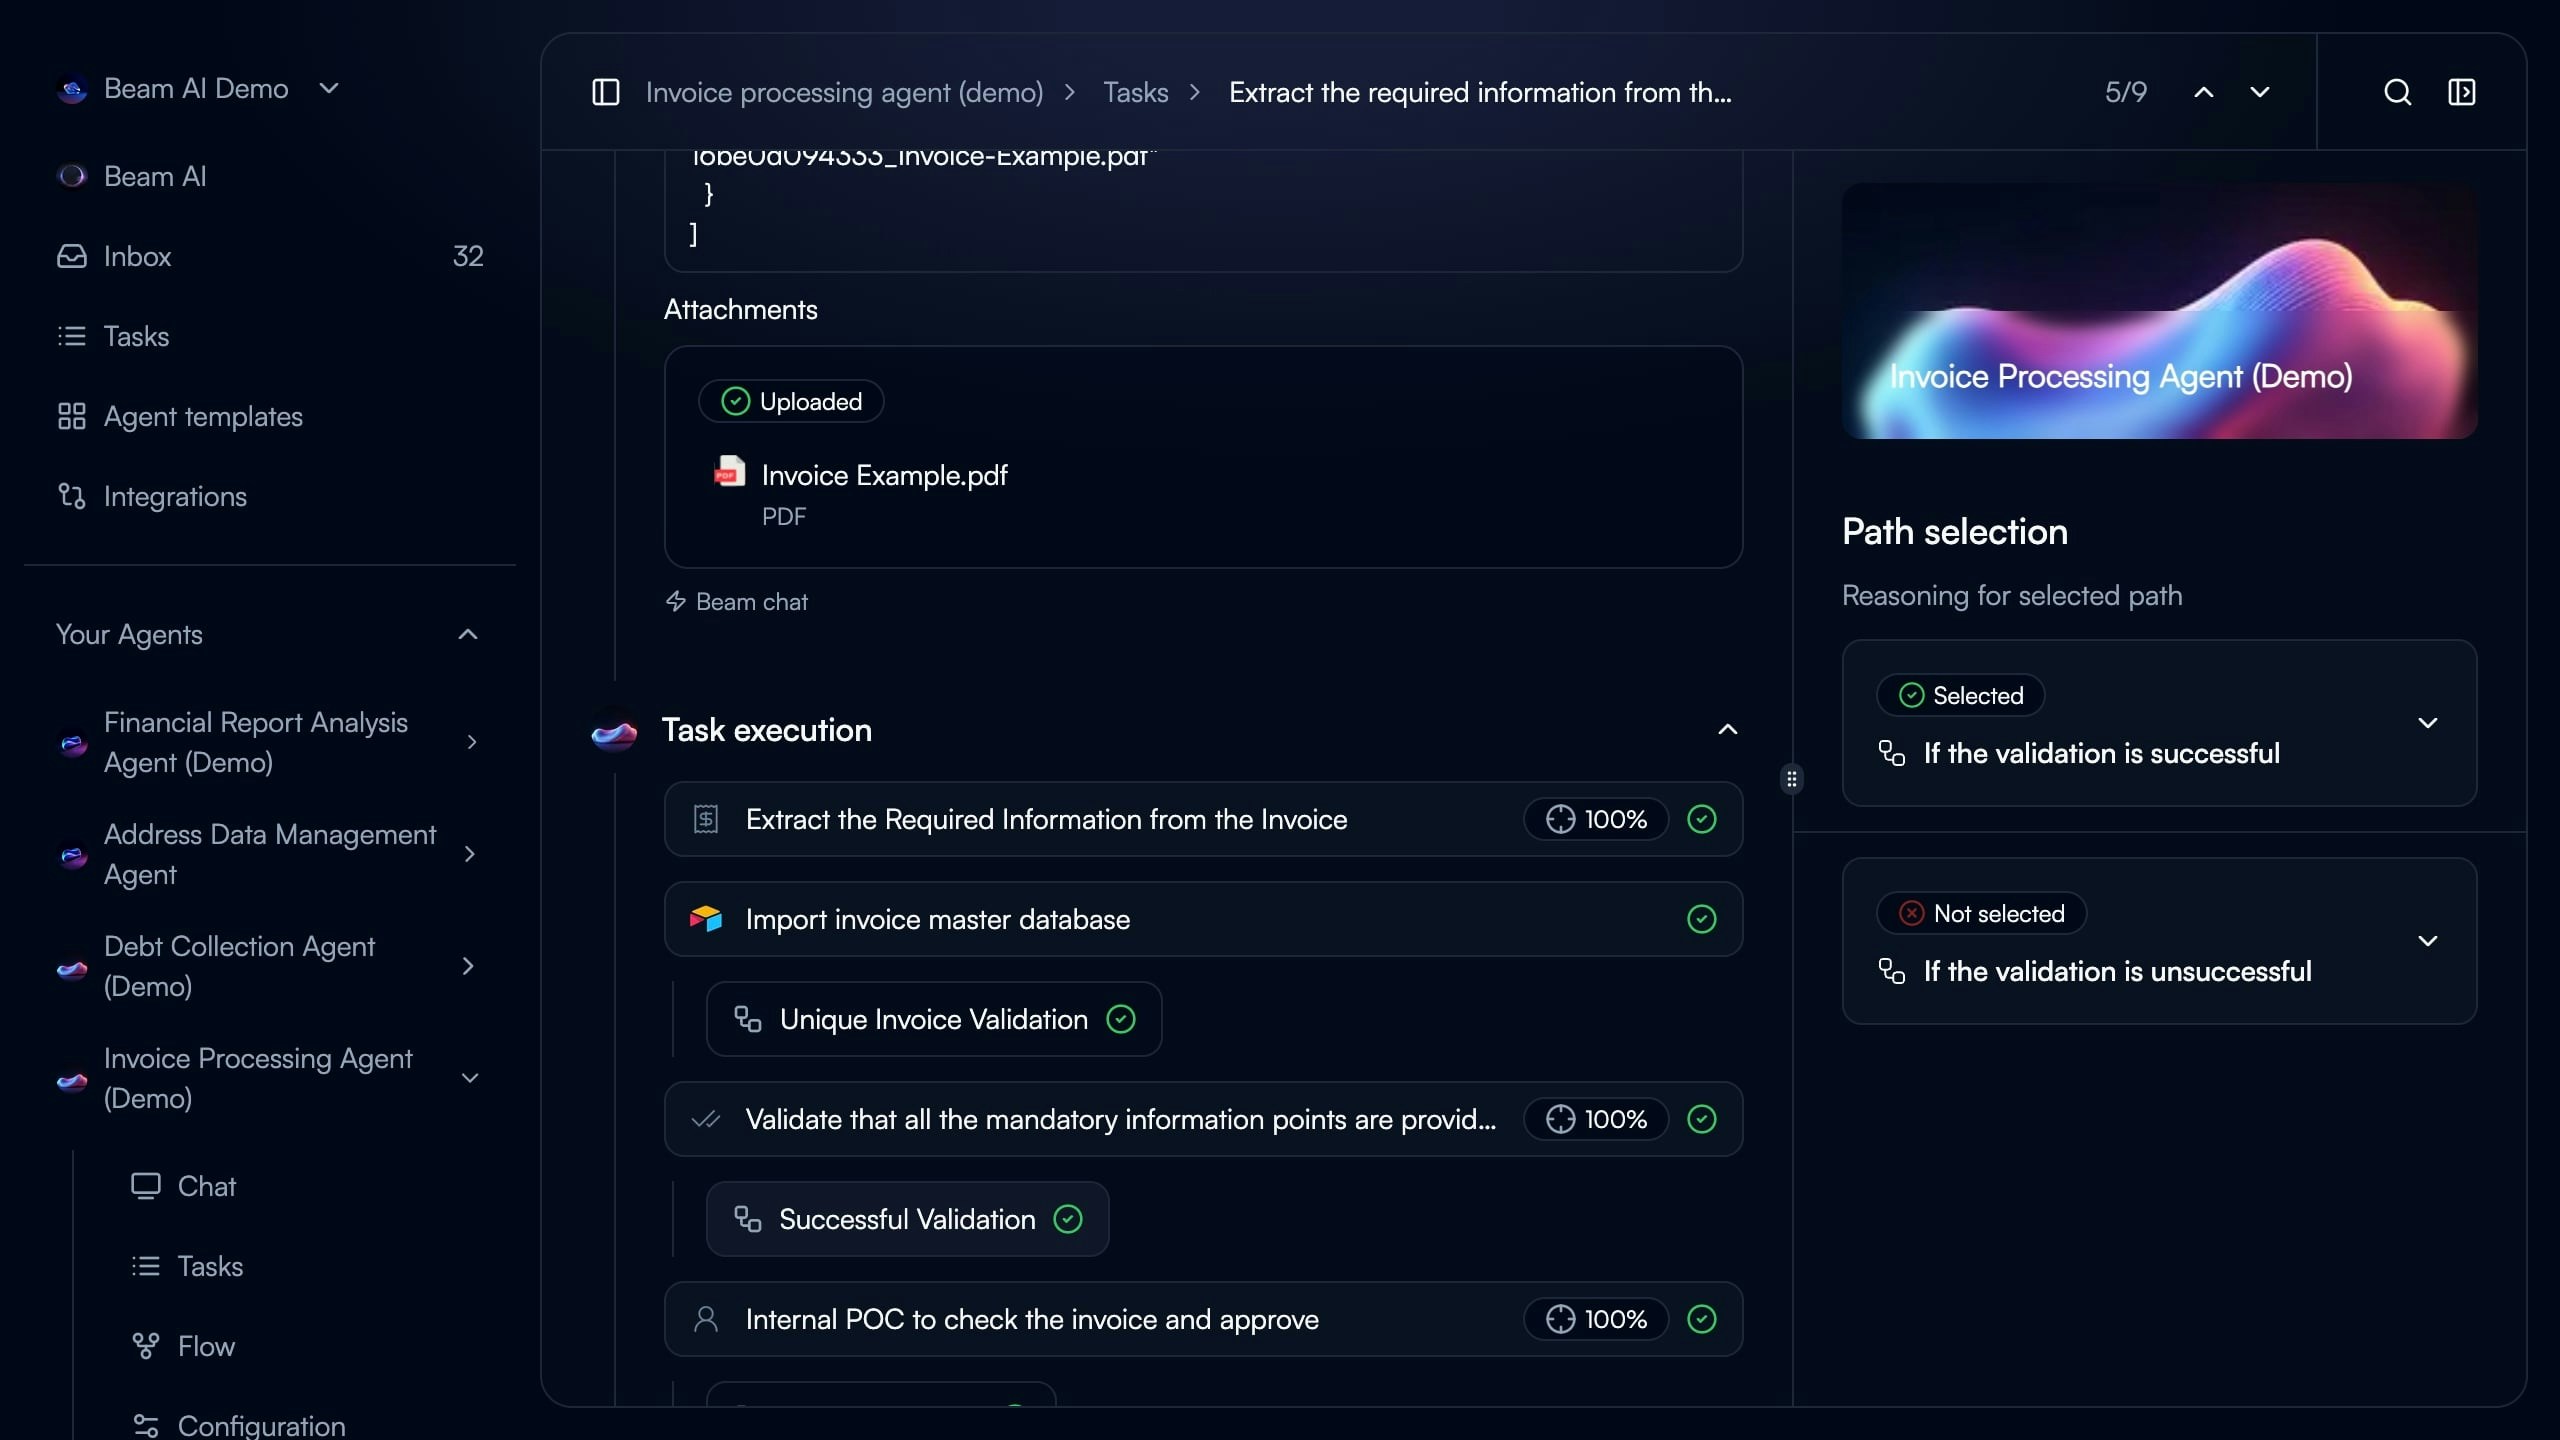
- Selected Path: Highlighted with green checkmark icon
- Not Selected Path: Grayed out with red X icon
- Condition Logic: Expandable dropdown showing “If the validation is successful” vs “If the validation is unsuccessful”
- Reasoning: Why agent chose specific path based on previous step outputs
Creating & Managing Tasks
Manual Task Creation
Trigger tasks manually for on-demand processing or testing using the Create Task button.Custom Instructions
Custom Instructions
Enter natural language instructions for the agent to process.Example:Agent interprets instructions and routes to appropriate workflow nodes.
File Upload
File Upload
Attach documents for the agent to process:
- PDFs, Word docs, Excel spreadsheets
- Images (JPEG, PNG for OCR)
- CSV data files
- URLs to parse
task_query.encodedContextFiles.Re-run Previous Task
Re-run Previous Task
Select from recent executions to rerun with same inputs.Use Cases:
- Test workflow changes with known data
- Debug failed executions
- Verify fixes after agent modifications
- Compare results before/after optimization
JSON Input
JSON Input
Provide structured data directly for precise testing.Example:Matches webhook payload format for integration testing.
Performance Metrics
Track agent performance across all task executions: Completion Rate - Percentage of tasks finishing successfully Average Runtime - Mean execution duration from start to completion Evaluation Scores - Average accuracy across all steps and tasks Success by Trigger - Completion rates by trigger source (Email, Webhook, Manual, Timer)Analytics Dashboard
Analytics Dashboard
Access detailed performance data through the Analytics tab.Completion Trends - Visualize task completion rates over time with daily, weekly, monthly aggregationRuntime Analysis - Identify slowest steps and bottlenecks in execution flowEvaluation Insights - Track quality improvements and failure patternsTool Performance - See which integrations perform best with success rates and response times
Debugging & Best Practices
Debugging Failed Executions
Failed tasks appear with red status indicator in task list. Common Failure Causes: Validation Failure - Step didn’t meet evaluation criteria (e.g., accuracy < 90%) Tool Error - Integration API returned error or timeout Missing Data - Required field not present in trigger input or previous step output Timeout - Execution exceeded maximum duration limitIdentify Failed Step
Scroll through execution timeline to find red X status icon. Failed step shows error message and which criteria wasn’t met.
Check Step Input
Verify the node received expected data format. Common issues: incorrect variable mapping, null/empty previous step, data type mismatch.
Review Tool Output
Examine what the tool actually returned vs expected. Integration errors often include API error codes.
Analyze Evaluation Scores
Look at which evaluation criteria failed. Adjust criteria thresholds or improve prompts based on failures.
Regular Execution Reviews
Regular Execution Reviews
Check task executions daily during initial deployment:
- Monitor completion rates
- Review evaluation scores
- Identify recurring failures
- Validate output quality
Set Up Failure Alerts
Set Up Failure Alerts
Configure notifications for execution failures via email, Slack, or webhook to ticketing system. Respond quickly to prevent backlog buildup.
Baseline Performance Metrics
Baseline Performance Metrics
Establish expected performance benchmarks:
- Target completion rate (e.g., 95%)
- Maximum acceptable runtime (e.g., 2 minutes)
- Minimum evaluation scores (e.g., 90%)
Test with Production Data
Test with Production Data
Use re-run feature to test changes:
- Keep 10-20 representative tasks saved
- Re-run after workflow modifications
- Compare results before/after changes
Tasks Stuck in Pending
Tasks Stuck in Pending
Cause: Human-in-the-loop approval required or queue backlogSolution:
- Check Automation Modes settings (HITL enabled?)
- Review pending approvals in Inbox
- Verify agent has sufficient processing capacity
Inconsistent Evaluation Scores
Inconsistent Evaluation Scores
Cause: Evaluation criteria too broad or subjectiveSolution:
- Make criteria more specific and measurable
- Use exact value matching instead of fuzzy matching
- Regenerate criteria based on successful tasks
Execution Timeline Not Updating
Execution Timeline Not Updating
Cause: Real-time connection lost or browser cached stateSolution:
- Refresh page to reconnect WebSocket
- Check network connection stability
- Clear browser cache if issue persists
Next Steps
Automation Modes
Configure human-in-the-loop workflows and approval processes
Rerunning Tasks
Test workflow changes with previous task data
Evaluation Framework
Set up quality criteria and accuracy scoring
Optimize Outputs
Improve agent performance with AI-assisted optimization